
When every flower room switches on in the same minute, the facility's highest draw of the month is created inside a single 15-minute window, and the utility bills that window for the entire month. This page covers what a demand charge is, why lighting owns the peak, the three schedule levers that flatten it, the ratchet clause that turns one hot afternoon into a year of charges, the load arithmetic behind the panel, and the kilowatt-hours-per-gram figure that tells you whether any of it is working.
The Two Numbers on a Commercial Bill
Residential accounts pay for consumption. Most commercial accounts pay for consumption and for capacity, and the two lines behave differently. The energy charge multiplies everything you consumed across the month by a price per kilowatt-hour. The demand charge takes the single highest average draw, measured in kilowatts, recorded over any 15-minute interval in the billing month, and multiplies that by a price per kilowatt. A useful way to hold the difference: the energy charge is the water you used; the demand charge is the size of the pipe the utility had to keep ready for the moment you opened everything at once.
The capacity logic is real, not a fee invention. Transformers, switchgear, conductors and substation capacity all have to be sized for a customer's worst simultaneous moment rather than its average, and the demand charge is how the tariff recovers that readiness. The mechanism is standard energy-management fare, documented in utility guidance such as the Pacific Northwest National Laboratory's FEDS materials; the actual prices sit on your tariff card, not on this page, because they move and they are local. What does not move is the arithmetic that lights the number up in a cultivation facility.
| Line item | Unit | What it measures | The question it answers |
|---|---|---|---|
| Energy charge | kWh | Consumption accumulated across the billing month | How much electricity did we use? |
| Demand charge | kW | Highest 15-minute average draw in the month | How large was our worst simultaneous moment? |
| Demand ratchet | % of trailing peak | A billing floor carried forward from earlier months | How long does one spike keep billing? |
| Load factor | ratio | Average draw divided by peak draw | How flat is the shape of our load? |
| Energy per gram | kWh/g | Electricity consumed per gram of dried flower | Is the facility converting power into flower? |
Two facilities can consume identical kilowatt-hours and pay different bills, because the one with the spikier profile reserves more capacity. In cultivation the effect is large enough that the Southwest Energy Efficiency Project's best-practices guide for grow operations notes monthly demand charges can reach the size of the energy charges themselves. That is the number most operators have never audited, and it is the number the light schedule writes.
Load Factor: The Exchange Rate Between $/kW and ¢/kWh
A dollars-per-kilowatt line is hard to weigh against the cents-per-kilowatt-hour figure on the energy line, and load factor is what puts the two on one scale. It is average draw divided by peak draw over the same period: a facility averaging 200 kW against a 400 kW peak has a load factor of 0.5, which is the shape of a clean 12-hour lighting block with little else running.
Once that ratio is known, a demand rate converts into an adder carried by every kilowatt-hour consumed:
demand adder (¢/kWh) = 100 × demand rate ($/kW) ÷ [ load factor × hours in the period ]
Run the same illustrative $10 per kilowatt this page uses for the ratchet arithmetic through a 730-hour month. At a load factor of 0.5 the adder is about 2.7 cents per kilowatt-hour; at 0.25 it doubles to about 5.5, because the same peak is now spread across half as many kilowatt-hours. The check is direct: at 0.5, a facility peaking at P kilowatts consumes 365P kilowatt-hours and pays 10P dollars, and 10P divided by 365P is 2.7 cents.
That identity produces the counter-intuitive result worth carrying into any lighting decision: shortening the photoperiod does not reduce the demand line, and it raises the adder on every kilowatt-hour that remains. A 100 kW lighting block running 12 hours has a standalone load factor of 0.5. Run the same block for six hours and the load factor falls to 0.25, so the peak charge lands on half as many kilowatt-hours and the effective cost per kilowatt-hour doubles. Fewer light hours save energy charges and nothing else, and the peak kilowatt figure is unchanged either way. Three premises attach to that: the load is constant while it runs, no ratchet is active, and no power factor adjustment applies.
Why Lighting Sets the Peak
Lighting is usually the largest schedulable load in the building, and it behaves in a way metering punishes: it is a rectangular block. Fixtures sit at full output for the whole photoperiod, and an LED reaches full output within seconds of switch-on, so the block has vertical walls. Older HID rooms had a soft edge, because lamps struck and warmed up over minutes; LEDs removed it. The meter does not see a ramp. It sees the whole room, at once, for the entire window.
A concrete block helps. The 1,000 sq ft flower room in our case file runs 32 fixtures at 1,300 W, which is 41.6 kW of lighting before a single fan or dehumidifier. Three flower rooms of that scale flipping on the same clock put roughly 125 kW on the meter in under a minute, and that minute sits inside somebody's 15-minute interval. Flower rooms own the peak because their watt density is highest, and a vegetative room on an 18-hour photoperiod makes it worse: it sits inside every afternoon peak, in every season, which is precisely why the flower rooms' clock position is where the money is.
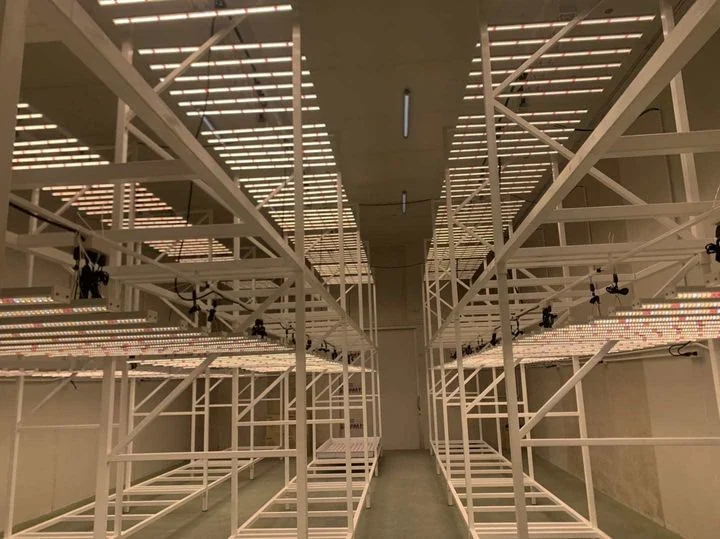
Lighting sets the floor of that number rather than the whole of it. The interval that sets the bill is usually a sum: the lighting plateau, plus dehumidification, cooling or a morning ramp sharing the same window. When you go looking for the cause of a high peak, expect to find the lights holding the floor and something else adding the increment, which is why attribution comes before any capital decision about the lighting itself.
Three Levers the Schedule Controls
Stagger Room Clocks, Not Start-Up Seconds
The cheapest demand reduction in the industry is a schedule edit. Offset room start times so no two flower blocks reach full output inside the same 15-minute window: the common commercial pattern runs half the rooms midnight to noon and half noon to midnight, and scheduling guidance for cultivation facilities is blunt that even a one-hour overlap between flower schedules raises the spike. Rocky Mountain Institute's work on cultivation load profiles found most large operators already stagger this way to hold a flat curve, which tells you both that the lever is proven and that your competitors may already be pulling it.
One warning earns its own sentence: relocating the cliff is not flattening it. If every room is moved to the same cheap off-peak minute, the timer has just built a new peak, the same failure mode the electric-vehicle-charging literature calls a timer peak. Stagger means spread across minutes and rooms, and it is worth putting a name on the ceiling: the highest kilowatt draw the schedule should ever allow.
Two different measures travel under the word stagger, and most of the bad advice about it comes from mixing them up. One moves the instant each contactor energizes; the other moves the hours a room is lit. Only the second one is ever visible on an interval-averaged bill.
| What is being staggered | Time scale | What it fixes | Does it move the demand line? |
|---|---|---|---|
| The switch-on instant | Seconds to a few minutes | The surge that breakers, contactors and transformers see | No |
| The photoperiod window | Hours | How many rooms are lit at once | Yes, when it separates the rooms |
The ramp paragraph below is the same point from the other direction: electronics can soften a start, and the meter still averages the window.
Move the Photoperiod, Keep the Darkness
Cannabis is a short-day plant, and the flowering switch responds to the length of uninterrupted darkness, not to where the light block sits on the 24-hour clock. That was the finding behind our spectrum guide's flowering-switch section, and it is also an electricity asset: the light block can be placed in the cheap hours without touching the plant signal. Overnight flower schedules are standard practice in time-of-use territories for exactly this reason, and RMI's modelling of a Colorado tariff found that shifting vegetative and flower schedules off the 2 to 6 pm system peak removes the large majority of afternoon lighting demand.
Two checks come before the move. The dark period has to stay dark, because a light leak costs a flowering room more than any arbitrage saves, in yield terms the plant never agreed to. And the climate boundary moves with the light: night running in a hot climate puts the heat fight in cooler hours, while a cold-climate room may simply trade a lighting peak for a heating one. The room-terms glossary carries the heat-side vocabulary; the point here is that the clock move is free for the plant but is never free for the building.
Ramp and Dim Around the Window
Honesty first: a soft-start ramp is electrical hygiene, not a billing lever. Because the meter averages over 15 minutes, a fixture bank that reaches full output five minutes later inside the same window barely changes the window's average. The billing lever is still the room schedule: what matters is how many fixtures are at full output inside any single interval.
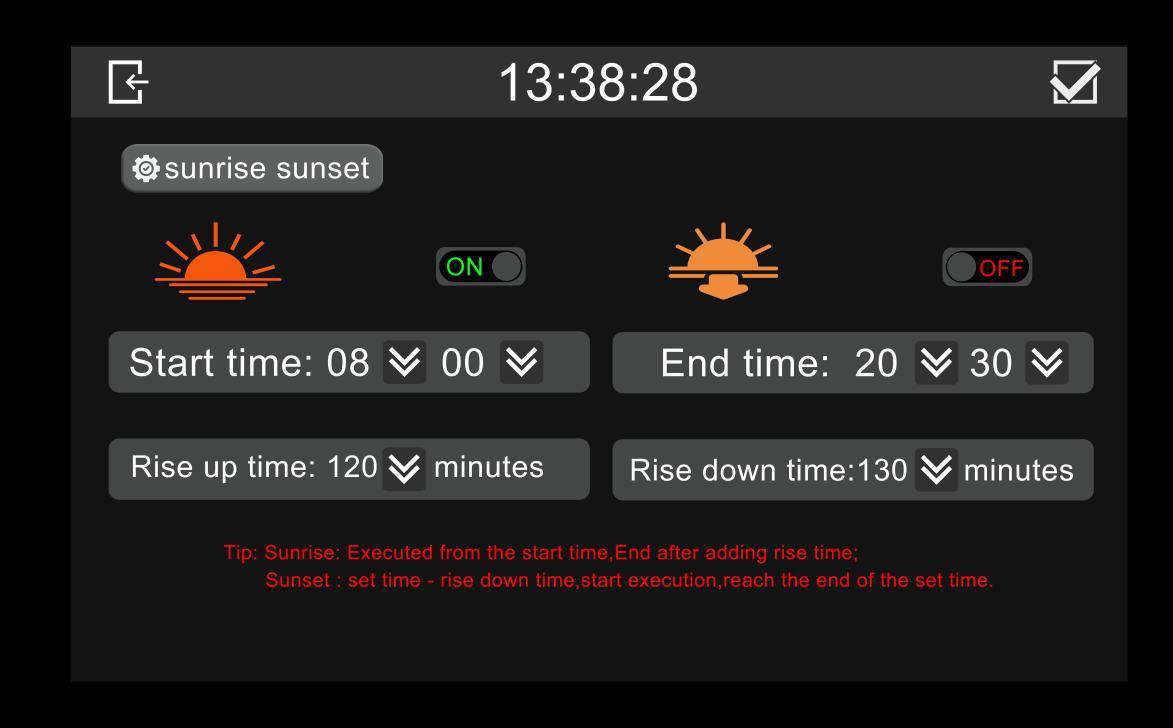
What a controller adds is enforcement. A multi-zone unit with grouped schedules, several timed segments per day and sunrise and sunset ramps keeps the stagger intact when staff, seasons and crop turns try to blur it, and a dimming cap can hold one room under a kilowatt ceiling during the hours that set the peak. Dimming for the bill is a real reduction in that window, but photons are the crop's budget: the canopy-side argument for when not to dim lives in our light burn guide, and it should win any argument with the meter.
Which Peak Is It? Coincident, Non-Coincident and Time-Limited
Everything above assumes the tariff is watching your own worst interval. Not every commercial rate works that way, and the difference decides which lever actually pays.
Non-coincident demand is your own highest interval at any hour of the billing period, which is the default on most commercial rates. Coincident demand is measured only during the hours when the utility's own system or local network peaks, either identified after the fact or written into the rate as stated windows; the four-coincident-peak method used in one US market bills on a few hours spread across four summer months. A time-limited demand charge is the same idea with the window printed on the sheet, such as weekday afternoons in a stated season.
| Structure | Which peak it bills | When it is measured | What a lighting schedule can do |
|---|---|---|---|
| Non-coincident | Your own highest interval | Any hour of the billing period | Separate the room photoperiod windows to flatten your own plateau |
| Coincident or time-limited | The grid's peak, or the peak inside a stated window | Only inside that window, or at the system peak | Move the photoperiod out of the window, if the crop allows it |
| Ratchet-adjusted | A percentage of an earlier peak | Set in a period that has already closed | Nothing this period: the earlier peak was the one to avoid |
Two practical notes sit under that table. The window length itself varies, because 15 minutes is the most common commercial interval and the resolution most interval data is reported at, while 30-minute windows appear on several large time-of-use rates and 60-minute windows on some smaller services; the mechanism on this page holds its shape, but the numbers move with your own sheet. And some rates bill demand in kVA rather than kW, which puts reactive current and harmonic distortion inside the measured quantity and turns driver power factor into a billing parameter rather than a datasheet detail.
The Ratchet: How One Hour Prices a Year
Some tariffs add a mechanism that makes the peak expensive long after the afternoon that set it. The standard form, documented in the PNNL guidance: the billed demand for any month is the higher of the actual demand that month or a percentage, commonly 80%, of the highest peak recorded in the previous 11 months. One exceptional interval can therefore set a floor under eleven more monthly bills.
The arithmetic is worth doing once, with an illustrative rate and the honest caveat that every tariff prices this differently. A facility peaks at 500 kW one August afternoon when flower blocks and a cooling fight stack together. The ratchet floor is 400 kW. At an illustrative $10 per kilowatt, that August bills $5,000 of demand; the following month the same facility runs a lean 300 kW and is still billed on 400 kW, or $4,000, for capacity it did not use. Eleven months of floors is a fixture-budget-sized number bought by a single scheduling decision.
Nothing resets a ratchet automatically. The floor decays only after the look-back window passes with demand held under it, and some facilities negotiate modifications by bringing a year of interval data to their utility's commercial team. The operational translation: the cheapest hour is the one that never sets a new peak, and demand alarms belong in the commissioning checklist, not in the post-bill autopsy.
The Load Sheet: Amps, Circuits and Panel Headroom
Under every scheduling decision sits a sheet of electrical arithmetic, and it starts from wall watts, not the sticker. Current in amps equals watts divided by volts times power factor. A 1,000 W fixture on 240 V with a 0.95 driver power factor draws about 4.4 amps, about 4.2 at unity; on 120 V the same fixture draws roughly twice that, around 8.3 amps. Drivers differ, so the nameplate or the specification sheet wins over any rule of thumb.
Every photoperiod is a continuous load by code definition, meaning three hours or more, and continuous loads are limited to 80% of a breaker's rating. A 20 amp circuit at 240 V therefore carries 16 amps continuously, which is roughly three to four of those 1,000 W fixtures. Multiply that across rooms and the lighting schedule, not the climate system, is what sizes the service, the conductor runs and the panel headroom. It is also why a conversion to efficient fixtures frees electrical capacity rather than merely saving energy; our LED versus HPS guide treats panel work as one of the hidden cost lines for exactly this reason, in both directions.
The fixture-side version of the same arithmetic is the driver's electrical quality. The DesignLights Consortium's horticultural requirements, version 4.0, set a minimum power factor of 0.9 and a current distortion limit of 20 percent alongside the efficacy threshold covered in our efficacy page. Both figures matter twice on a kVA-billed rate: once on the demand line, and once if the utility applies a power factor adjustment.
| Load sheet line | What to compute | Why it feeds the bill |
|---|---|---|
| Wall watts per room | Fixture count × nameplate draw, at the wall | The demand block and the energy charge both start here |
| Current per circuit | Watts ÷ (volts × power factor) | Circuit count, conductor size and panel space |
| Continuous headroom | 80% of each breaker's rating | Photoperiods are continuous loads by definition |
| Demand ceiling | The kW the schedule should never exceed | The number a controller or sub-meter alarm enforces |
The Number Worth Tracking: Kilowatt-Hours per Gram
Demand shaping and consumption are different dials, and the dial that measures the second one is electricity per gram of dried flower. Published figures for cannabis vary with method, and the variation is itself informative: modelled studies, metered facility audits and market surveys do not agree to the decimal, so the figures below are ranges to trend against, not grades to fail an audition with.
| Source | Figure | Basis |
|---|---|---|
| Mills 2012 | ~6.1 kWh/g | Model of pre-LED practice, US average |
| New Frontier Data & RII 2018 | ~1.27 kWh/g | Contemporary market model after LED adoption |
| Cannabis Conservancy 2018 | 2.6 kWh/g median | Metered audits, five indoor Colorado facilities |
| Canadian industry study 2024 | ~1.9 to 2.1 kWh/g | Provincial model of licensed indoor production: lighting a constant 1.35, HVAC the rest |
| Industry operating guides | ~1.5 to 3.5 kWh/g | Target range for well-run modern rooms; legacy HID rooms in warm climates often 4 to 6 |
The lighting-only floor explains why the rest of the building dominates the meter. From the efficacy conversion: a fixture at 3.0 µmol/J banks 10.8 mol of photons per kilowatt-hour, so a 40-mol flowering DLI across a 65-day cycle needs roughly 2,600 mol per square metre, which is about 240 kWh per square metre of canopy before any vegetative room, climate system or plug load. Light is the reason the facility exists; it is a minority of what the meter records, and the efficiency page already covers how the lighting saving shows up a second time through the climate system.
Tracking it is a small operations project, and the best-practices guide is specific about the method: request the utility's interval data, which most commercial meters already record, or install a customer-side meter, which the guide prices at roughly $1,000 to $1,500, to get a per-room breakdown. Log kilowatt-hours and dried grams every cycle and hold the facility to its own baseline. Methodologies differ enough between published studies that the trend line matters more than the league table.
Keep the two dials separate when the results come in. Staggering the schedule lowers the kilowatt line without moving the kilowatt-hour line; fixture efficiency lowers the kilowatt-hours without flattening anything. A flat profile on old fixtures is a well-shaped bad bill, and a sharp profile on efficient fixtures overpays for capacity every month. The bill rewards doing both, in that order: shape first, because it is free, then efficiency, because it is bought.
Where the Schedule Lever Stops
The schedule lever has a hard boundary, and it is worth naming because the shortcut is tempting. A 2025 controlled trial from the University of Connecticut tested a vegetative night break: a 12-hour light block plus a single hour of light in the middle of the night, which would cut lighting electricity by nearly a third. The measured cost: extractable floral biomass down about 22%, 1,015 grams against 1,295 in the control tents, with shorter, less vigorous plants. The authors' own verdict was that the method is not economically feasible. The dark bank is doing paid work; interrupting it buys a small electricity saving with the crop's own capital.
The same boundary guards the flowering room from the other side. Arbitrage moves the light block around the clock; it does not shorten the dark period, and the flowering switch, as our spectrum guide puts it, is darkness and not colour. Inside that boundary, the schedule is one of the few levers in a cultivation facility that costs nothing to pull and shows up on the next statement. The cheapest kilowatt-hour remains the one the canopy still converts.
The Bill Review Checklist
One working session with the tariff card and the interval data finds most of the money. The checklist:
| Check | What to look for |
|---|---|
| Rate class and ratchet | The tariff card: demand window length, ratchet percentage and look-back months |
| The demand line | This month's billed kilowatts against the facility's measured peak; a persistent gap means a ratchet floor is active |
| Interval data | Request the 15-minute series and identify what switches on inside the highest window |
| Room schedule map | Every room's light block on one 24-hour chart; count the rooms at full output per window |
| Demand alarm | A controller or sub-meter limit set below the historical peak, so a new peak is a decision rather than a surprise |
Demand Charges and Lighting Load FAQ
What is a demand charge on a commercial electricity bill?
A fee based on the facility's highest average power draw, in kilowatts, over any 15-minute interval in the billing month, multiplied by the tariff's price per kilowatt. It is billed separately from the energy charge, which prices consumption in kilowatt-hours. Utilities charge it because transformers, conductors and substation capacity must be sized for a customer's worst simultaneous moment, not the monthly average.
Can demand charges be larger than the energy charge?
Yes. The Southwest Energy Efficiency Project's best-practices guide for grow operations notes that monthly demand charges can reach the size of the energy charges. Rooms that all switch on together make that likelier: one simultaneous start sets a single 15-minute window, and that window prices the whole month.
Do staggered light-on times actually save money?
Under demand-based rates, yes. Staggering room start times spreads the fixtures across different 15-minute windows, so the billed peak is lower while the kilowatt-hours are unchanged, and scheduling guidance for cultivation facilities is blunt that even a one-hour overlap between flower schedules raises the spike. One warning: moving every room to the same cheap off-peak minute recreates the spike you just removed. Stagger means spread, not relocate.
Should I run my grow lights at night to pay less for electricity?
In time-of-use territories, overnight light blocks are standard practice for exactly this reason, and the plant permits it: the flowering switch responds to the length of uninterrupted darkness, not to the clock position of the light period. Two checks come first. The dark period must stay dark, because a leak costs more than the arbitrage saves, and the climate system must be rebalanced for the hours the heat now lands in.
What is a demand ratchet?
A tariff clause that sets the monthly billed demand at the higher of the actual demand or a percentage, commonly 80%, of the highest peak recorded in the previous 11 months. One afternoon can therefore price eleven more months. The floor only decays after the look-back window passes with demand held below it, which is why peak management belongs at commissioning rather than in the post-bill review.
How many amps does a 1000W grow light draw?
Current equals watts divided by volts times power factor. A 1,000 W fixture draws about 4.4 amps at 240 V with a 0.95 driver power factor, and roughly twice that, about 8.3 amps, at 120 V. Because a photoperiod is a continuous load, electrical code limits each circuit to 80% of its breaker rating, and that number, not the wattage alone, is what sizes circuits and panel space.
What is a good kWh-per-gram figure for a cannabis facility?
Published figures span roughly 1.3 to 6 kWh of electricity per gram of dried flower depending on method and facility age: a contemporary market model put the average near 1.27, metered Colorado facilities median 2.6, and industry guides target 1.5 to 3.5 for a well-run modern indoor room, while legacy HID rooms in warm climates often run 4 to 6. Use the figure to track your own trend across cycles rather than to rank facilities measured by different methods.
Does dimming my LEDs lower the demand charge?
Dimming reduces the kilowatts drawn during the window, so a dim applied across the hours that set the peak does lower it. Used casually it just moves photons around, and photons are the crop's budget: the canopy-side argument for when not to dim lives in our light burn guide, and it outranks the meter. The bill-side sequence is the schedule first, dimming second.
What is a night break lighting schedule?
A vegetative schedule that splits the daily light into a 12-hour block plus a one-hour interrupt in the middle of the night, cutting lighting electricity by nearly a third. A 2025 controlled trial measured the cost: extractable floral biomass down about 22%, with shorter and less vigorous plants, and the authors judged the method not economically feasible. The dark period is doing paid work; interrupt it only with that trade in view.
Does staggering fixture startup lower my demand charge?
Not on a tariff that bills the highest 15, 30 or 60 minute average demand, provided the lighting runs as a continuous block. Staggering the switch-on instant moves the surge that breakers and contactors see, not the kilowatts an interval averages, and a lighting plateau fills every interval it touches. Staggering the hours different rooms are lit does lower the billed peak. The two measures share a name and nothing else.
Does running my lights fewer hours lower the demand charge?
No. Fewer hours reduce kilowatt-hours, so the energy charge falls, but the peak kilowatt figure is unchanged and the demand line is priced on peak kilowatts. Shortening the photoperiod also raises the adder the demand charge places on every remaining kilowatt-hour, because the same peak now spreads across fewer of them. Only a lower peak lowers the demand line.
What is the difference between coincident and non-coincident demand?
Non-coincident demand is your own highest interval at any hour of the billing period, and it is the default on many commercial rates. Coincident demand is measured only during the hours when the utility's system or local network peaks, either identified after the fact or written into the rate as stated windows. The distinction decides which lever pays: separating room photoperiods flattens your own peak, while moving the photoperiod window addresses the utility's.
Rebuilding the Schedule Across Rooms?
Tell us the room count, the fixture list and the load questions your electrician raised: we will come back with a controller-integrated lighting plan and indicative pricing.